
Seven must-have white-label reporting features for vehicle-based DOOH: branding, access, live analytics, exports, alerts, geo, proof-of-play.
If you sell vehicle-based DOOH, reporting is part of the sale. When a client spends $5,000 on a campaign, they expect proof that ads ran, where they ran, when they ran, and whether any screens went down.
Here’s the short version: I’d look for 7 report features in any white-label DOOH setup:
These features do three jobs at once:
For mobile screens, this matters even more than it does for static boards. A moving screen can cross several neighborhoods in one shift, so reports need to tie each ad play to time + place + device. Without that, impression numbers alone don’t say much.
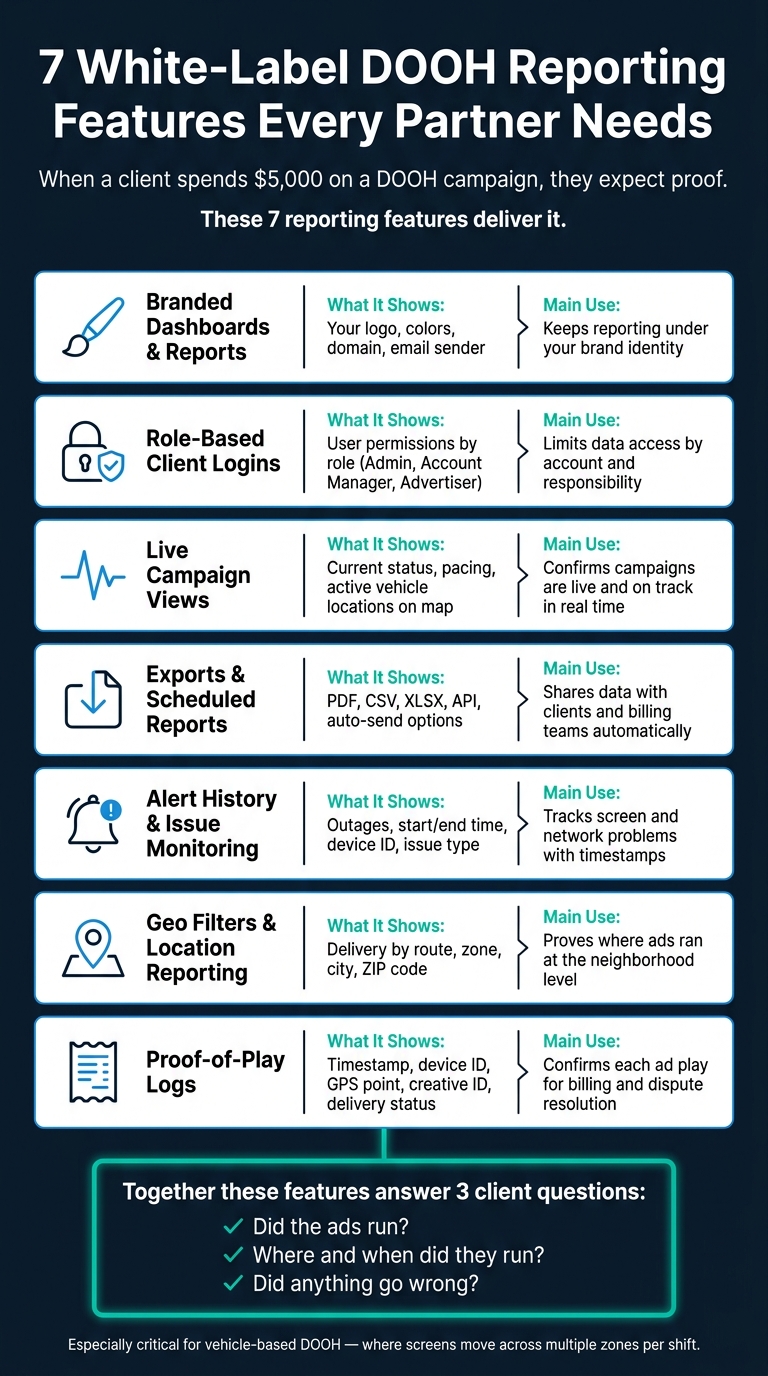
7 White-Label DOOH Report Features: What They Show & Why They Matter
| Feature | What it shows | Main use |
|---|---|---|
| Branded controls | Your logo, colors, domain, email sender | Keeps reporting under your brand |
| Role-based access | User permissions by role | Limits data access by account |
| Live analytics | Current status, pacing, active vehicles | Checks if campaigns are live and on track |
| Exports and scheduling | PDF, CSV, XLSX, API, auto-send | Shares data with clients and billing teams |
| Alert history | Outages, start/end time, issue type | Tracks screen and network problems |
| Geo filters | Delivery by route, zone, city, ZIP | Shows where ads ran |
| Proof-of-play logs | Timestamped ad-level records | Confirms each play for billing and review |
Bottom line: if I’m choosing a white-label reporting stack for taxi-top or in-car DOOH, I want reporting that is branded, trackable, location-based, and easy to export. That’s what turns campaign data into client-ready proof.
When a brand manager approves a vehicle-based DOOH campaign, they want proof. Plain and simple. They need to know the creative ran in the right places, at the right times, and in front of real audiences. Reporting is what turns that promise into something they can check.
That need is even stronger with vehicle-based DOOH because the screens don’t stay put. A single vehicle can move through several neighborhoods and zones in one shift. That’s why location and time data carry more weight here than they do in static out-of-home.
Advertisers usually want a few specific things:
Each one answers a different question. And if even one layer is missing, things can get messy fast: delayed payments, disputed invoices, or slower renewals. Of course, none of this means much unless the impression data is credible and auditable.
Industry standards are moving toward standardized, verifiable reporting frameworks. That shift draws a clear line between a full-service media operator and a basic platform provider. Partners that offer branded dashboards, geo-filtered heatmaps, pacing charts, and proof-of-play logs aren’t just selling screen access. They’re offering a managed media service that can lead to longer contracts, higher margins, and stronger client relationships.
Those demands are exactly what the seven reporting features below are built to meet.
When an advertiser logs into a reporting portal, the interface shapes the relationship right away. If the portal looks like a generic vendor tool, it can feel like the vendor owns the product. That weakens the partner’s standing before the advertiser even looks at the data.
This feature lets partners brand dashboards, reports, emails, and login pages with their logo, colors, fonts, and domain. So a partner running a taxi-top and in-vehicle tablet network can send clients to something like reports.yourfleet.com instead of a generic vendor URL. As Enroute View Media puts it:
"Your customers won't see our branding - it's seamless as your own platform."
And this goes past adding a logo in the corner. The interface should look like your brand in every detail. White-label platforms let you apply brand colors across charts, tables, and navigation. You should also upload both light and dark logo versions so the portal displays well on different dashboard backgrounds and report cover pages.
For vehicle-based DOOH, branded reporting helps impressions, geo-time delivery, proof-of-play logs, and uptime feel like parts of a single service instead of a stack of separate tools. A branded sender address, such as reports@yourcompany.com, helps with that too. Match the sender name to your brand so each email, dashboard, and report feels like one product.
Branding makes the portal feel native; secure client access keeps it usable.
A branded portal only works if each user sees only the data and tools tied to their job. If access isn't set up with care, reporting visibility can turn from a selling point into a problem. So access needs to be role-based from day one, with permissions tied to roles, not individual people.
A white-label DOOH platform should set up three core roles:
As Enroute View Media notes:
"For multi-user access, we enforce role-based permissions and have internal cybersecurity team to monitor and respond to threats."
Accountability matters just as much. Every edit, export, and creative change should record the user, role, time, and action. That audit trail turns disputes into facts you can track. It also makes impression disputes and zone issues easier to sort out.
Once access is locked down, the next step is showing live campaign performance without delay.
Once access is locked down, clients usually want a simple answer: Is the campaign live?
A real-time dashboard should answer that right away. It should show whether the campaign is live, where it’s running, and whether delivery is on pace. That means showing today’s impression count, delivery against goal, and a map with active vehicle locations. Add color-coded pacing, and someone can scan the page and understand performance in seconds.
For operators, that same screen can also work as a control panel. It should show which screens are online or offline, the last check-in time for each vehicle, and real-time GPS location. If vehicles stop checking in, or a cluster of screens goes dark in one part of the city, operators can spot the problem fast and fix it before delivery takes a hit.
That kind of visibility also needs context. Audience data should be clearly labeled as estimated. Show impressions, reach by daypart, and simple audience segments, with a note that the numbers are modeled from GPS routes and mobility data.
Real-time visibility also makes mid-campaign optimization possible. If a campaign is over-delivering in one neighborhood and under-delivering in another, partners can rebalance geo fences or shift dayparts before the campaign ends.
Live dashboards show performance as it happens. Exports take that same data and turn it into something you can bring into a meeting, review offline, or send with an invoice. Put simply, exports turn live campaign data into client-ready records.
A white-label DOOH platform should support PDF, CSV, XLSX, and API access. Each format fits a different job, so teams don’t have to rebuild the same report over and over.
Scheduled delivery takes even more manual work off the table. Daily, weekly, or monthly report sends keep clients and teams up to date without someone having to pull files by hand each time. Enroute View Media's cloud-based white-label platform supports exportable reports and open API access, so partners can share campaign data through branded exports and API access.
Exports also play a big part in billing. CSV and spreadsheet exports create auditable records of what ran, where it ran, and when it ran - including timestamps, vehicle or screen IDs, locations, and delivery totals. If something looks off later, those records make it much easier to trace delivery gaps.
One more thing matters here: branding. Exported PDFs and email deliveries should stay tied to the partner’s brand, including the partner’s logo, colors, and domain.
Exports and scheduled reports cover the data you plan to send out. Alert history covers the stuff that breaks.
Once planned reporting is in place, the next job is exception tracking. If a rooftop screen goes offline or a vehicle loses LTE in the middle of a route, alert history records the issue, the start time, and how long it lasted. That gives you a timestamped record that helps protect delivery proof and patch billing gaps before advertisers point them out.
The best alert logs go beyond a basic online/offline flag. For vehicle-based DOOH, each alert should include:
Enroute View Media's platform logs real-time monitoring data, including offline alerts, screenshots, and uptime, so partners can trace each issue by vehicle and campaign window. That shifts a device alert from a simple system warning into a client-ready record.
"Real-time device monitoring: See if screens are online, view screenshots, and get alerts for offline devices." - Enroute View Media
Alert history also matters in advertiser conversations. If a campaign underdelivers, partners can pull a short incident summary that shows what happened, when it started, how long it lasted, and what was done to fix it. It also helps support replacement impressions matched to the original route and daypart.
Paired with proof-of-play logs, alert history shows what ran, what failed, and why.
Geo filters show where the campaign ran. In mobile media, location is part of the proof. After teams track issues, the next step is simple: where did delivery happen?
That’s where geo filters help.
Vehicles can move through several zones in a single shift. So raw play counts, by themselves, don’t say much. Geo filters turn those raw plays into location-based reporting that people can actually use. Partners can break out delivery data by city, neighborhood, ZIP code, named route, or a custom coverage zone. Each play can be tagged with GPS coordinates and then grouped by city, ZIP code, route, or custom zone. In plain English, that turns raw play counts into location-level proof of delivery.
These filters also turn live route data into reporting that’s ready for clients. Enroute View Media's platform supports geo-time targeted advertising, and geo-time targeting links each play to both a place and a time window. That extra layer matters. If a client wants to know not just how much ran, but where and when, the report can show it.
Accuracy matters here. High-accuracy GPS tracking gives partners stronger proof at the zone level. If the location data is off, the report gets shaky fast. But when GPS tracking is tight, zone-based delivery is much easier to verify and discuss.
For partners running multi-market campaigns, geo filters also make side-by-side performance checks easier. They can compare results by market and export those results for client review. Those insights can support ad-load changes and schedule adjustments. And that makes location reporting easier to explain during sales, service, and billing conversations.
Location reporting shows where a campaign went. Playback logs show whether the ad actually played on a given screen. After live monitoring and location filters, proof-of-play is the record that confirms delivery at the screen level.
Every ad play on a rooftop LED screen or in-taxi tablet creates a timestamped log entry. That entry ties the play to a time, vehicle, creative, and GPS point. In plain terms, it works like a line-item receipt for each ad play. That matters for billing, audits, and dispute resolution.
It also helps to keep two ideas separate. Proof-of-play verifies delivery. Impressions estimate exposure. Mixing those together can muddy the waters. Keeping them apart makes billing cleaner and easier to defend.
Enroute View Media's GPS-based tracking can achieve location precision of less than 1 meter. That means partners can show advertisers not only that a campaign ran, but exactly where each play happened. Status labels like DELIVERED, FAILED, and PARTIAL make the logs even more useful. They separate billable plays from non-billable ones and surface technical issues early, which makes reconciliation a lot less messy.
Use these core fields to standardize playback reporting.
| Log Field | What It Captures | Why It Matters |
|---|---|---|
| Timestamp | Exact date and time of each play | Verifies daypart targeting and billing periods |
| Vehicle / Device ID | Which screen delivered the ad | Supports per-vehicle performance reporting |
| Creative ID | Which ad asset ran | Confirms only contracted creatives are billed |
| Duration (seconds) | How long the ad was on screen | Required for time-based billing and compliance |
| GPS Location | Coordinates per play | Enables geo-zone delivery verification |
| Delivery Status | Delivered, failed, partial, etc. | Separates billable plays from non-billable events |
Two tables do the most to clean up reporting: export formats and proof-of-play logs.
In the export tools section, the main question is simple: which format works best for each reporting job? PDF fits client-ready summaries. CSV works for raw data transfer. Spreadsheets help with analysis. API fits automation. Put that side by side in a table, and the choice becomes much easier to scan.
The same idea applies to log fields. Here, layout matters just as much as the data itself. If the format is easy to scan, it’s easier to check, compare, and confirm what played.
In the proof-of-play section, the table should include these required fields:
| Field | What it shows |
|---|---|
| Timestamp | When the playback happened |
| Screen or device ID | Which screen or device ran the content |
| Location | Where the playback happened |
| Creative ID | Which asset was shown |
| Duration | How long it played |
| Playback status | Whether the playback completed or failed |
| Impression count | How many impressions were recorded |
Used this way, tables make reporting faster to scan and easier to verify.
The seven features above - branded controls, secure client logins, live campaign views, export tools, alert history, geo filters, and proof-of-play logs - are the backbone of a client reporting system people can trust. Together, they keep reporting accurate, on-brand, and easy to back up.
These tools turn campaign delivery into proof: what ran, where it ran, when it ran, and whether anything broke along the way. That kind of accountability matters even more in vehicle-based DOOH, where screens move across multiple zones and every play needs a record behind it.
Enroute View Media is built for that model in taxi and rideshare fleets. Enroute View Media gives taxi and rideshare partners white-label ad and screen management, real-time analytics, geo-time targeting, and proof-of-play logging - tools that help teams sell, report, and renew with confidence.
In white-label vehicle-based DOOH, reporting isn’t a back-office task; it’s part of the product.
In vehicle-based DOOH, proof-of-play matters because it swaps old guesswork for precise, verifiable delivery data. It shows when, where, and for how long an ad ran, along with actual impression counts.
That kind of transparency helps advertisers measure campaign performance, calculate ROI, and hold delivery to account. It also gives fleet operators useful insights to tune performance and report results advertisers can trust.
Look for a dashboard that shows real-time campaign stats like impressions, engagement rates, and budget pacing. That way, you can see what’s happening right now instead of waiting around for updates.
It should also include customizable analytics, so you can zero in on the metrics that line up with your goals.
On top of that, prioritize secure, role-based access and exportable reports in standard formats like Excel and PDF. API access can also make it easier to connect the platform with your current workflows.
Geo filters show campaign delivery by proving when and where an ad appeared. The Enroute View Media platform uses high-resolution GPS data and virtual boundaries to trigger ads only when a vehicle enters a set zone.
That links playback records to exact geographic coordinates, so advertisers can verify that their content showed up in the right place at the right time. Paired with real-time analytics, those logs give clear proof of performance.
Need pricing details?
EnrouteViewMedia is a Canadian technology company based in Edmonton, Alberta, Canada. The company was founded by a group of media entrepreneurs and engineering executives. Our mission is developing leading-edge digital media display technologies for taxicab rooftops and taxicab interiors advertising market. Through our easy to use ad delivery and management system, we assist our clients in reaching their customers with targeted exposure. EnRouteViewMedia continuously strives to be the global leader in digital geo-time targeted advertising media systems for modern taxi fleets.