
Plan event-based taxi DOOH with geo-time targeting, fleet coverage, rooftop vs in-cab formats, programmatic buying, and verified proof-of-play.
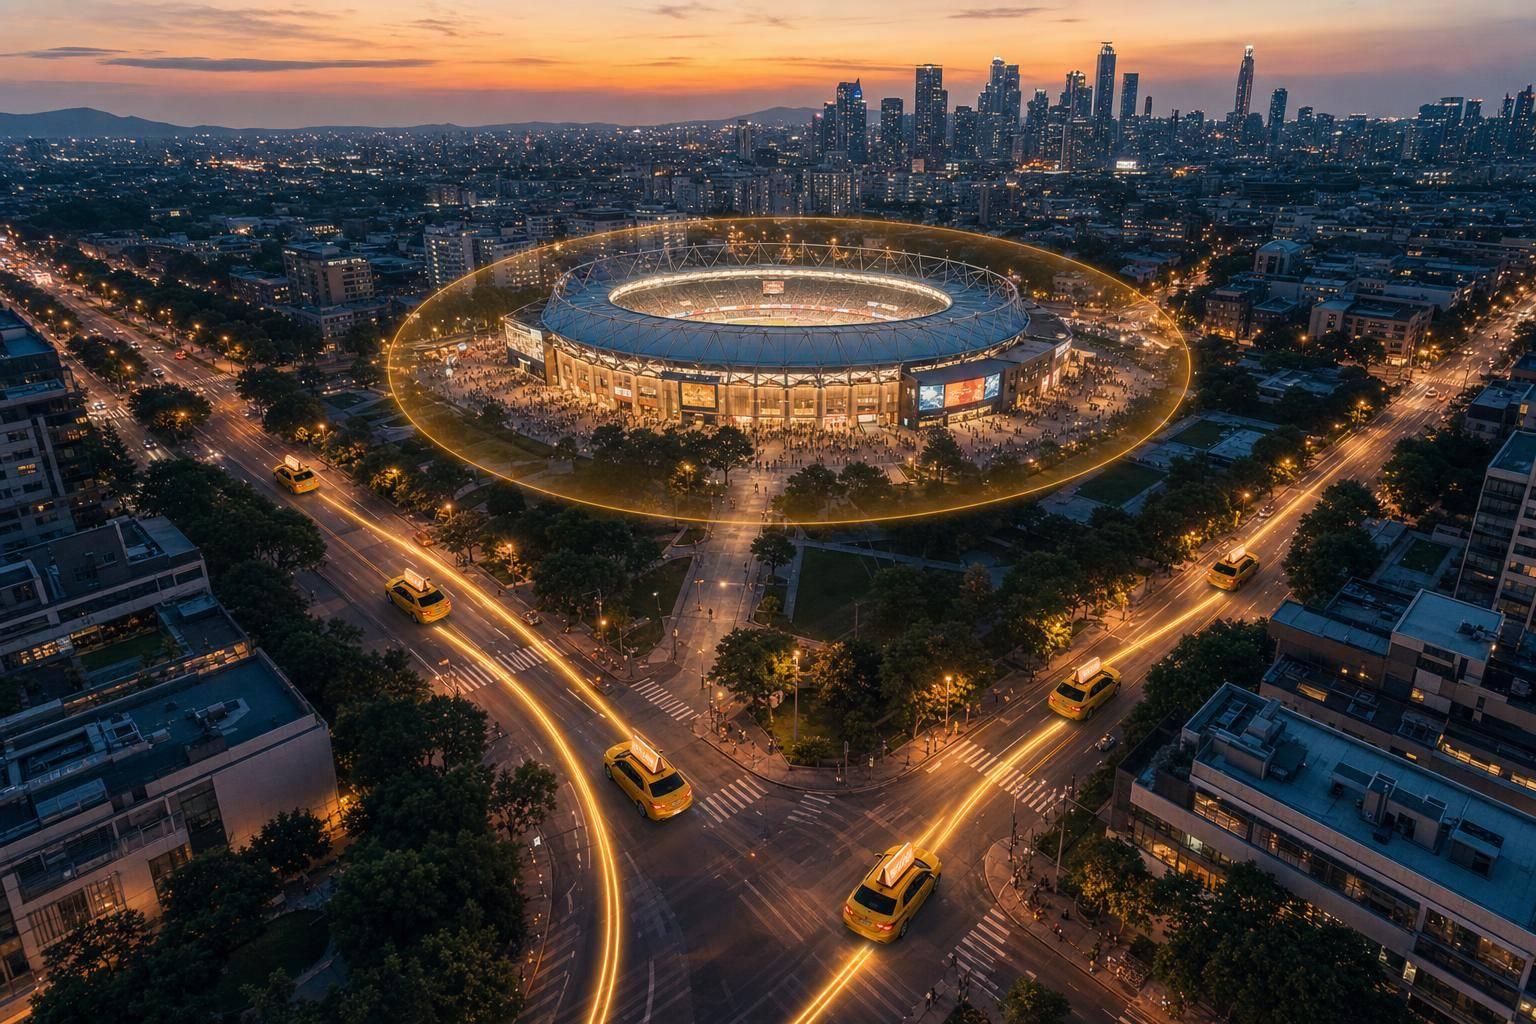
If I want event-based taxi DOOH to work in 2026, I need to match time, place, and screen type to the event crowd. The basic play is simple: I set geo-time rules, cover the right routes before, during, and after the event, use rooftop screens for short outdoor views, use in-cab screens for longer ride-time messages, and track proof-of-play with GPS logs and screen data.
Here’s the full article in plain terms:
One stat stands out: the article cites a 30% increase in engagement when ad delivery changed in real time during peak event hours. It also notes that rooftop screens above 5,000 nits stay visible in bright daylight, while in-cab rides often give viewers 10 to 30 minutes with a screen.
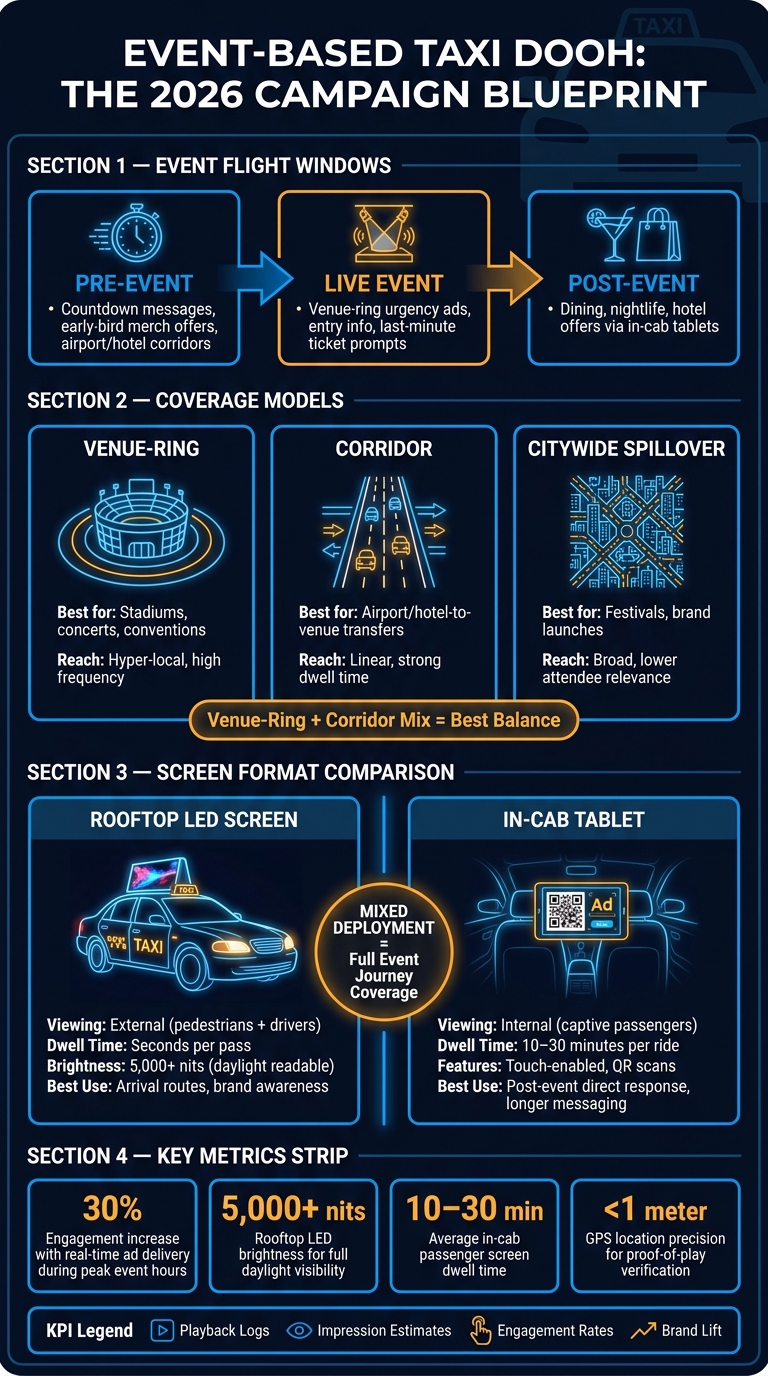
Event-Based Taxi DOOH: Screen Formats, Coverage Models & KPIs at a Glance
| Area | Main takeaway |
|---|---|
| Targeting | Use GPS + time rules to show ads only in event zones and time windows |
| Best coverage types | Venue-ring for density, corridor for travel flow, citywide for spillover |
| Best screen for awareness | Rooftop LED |
| Best screen for engagement | In-cab tablet |
| Best buying method for short runs | Programmatic setup |
| Main KPI set | Playback logs, impressions, interactions, brand lift |
| Main success factor | Align event phase, routes, message timing, and proof-of-play |
My main takeaway: event-based taxi DOOH is not about putting one ad near a stadium. It’s about following the crowd across the full trip, changing the message by moment, and checking that each screen ran in the right place at the right time.
Build each event campaign around three flight windows: pre-event, live-event, and post-event. Each one calls for a different message and a different level of delivery. That setup shapes both your coverage area and your vehicle count.
For the live window, focus on venue rings. For arrivals and departures, use transit corridors. GPS geofences let you define both with precision, so the right creative shows up at the right place and time.
Dayparting pulls the plan together. Increase delivery during the pre-event arrival rush, the live-event peak, and the post-event departure wave.
Match the coverage model to the way the event works: single-venue, corridor-based, or citywide. Once your event windows are locked in, choose the model that lines up with how people move.
| Coverage Model | Best Use Case | Reach Pattern | Trade-off |
|---|---|---|---|
| Venue-Ring | Stadiums, concerts, conventions | Hyper-local; high frequency near the entrance | Limited reach outside the immediate event perimeter |
| Corridor | Airport/hotel-to-venue transfers | Linear; strong dwell time in transit corridors | Lower density than venue-ring; dependent on traffic flow |
| Citywide Spillover | Festivals, brand launches, general hype | Broad reach across the city | Lower relevance to specific event attendees |
For most single-venue events, a mix of venue-ring and corridor coverage gives you the best balance. You get tight exposure near the venue, plus steady visibility where people are moving in and out. Citywide spillover fits better when the event pushes traffic across several neighborhoods and one geofence won't catch the full audience.
After you choose a model, put more budget into the zones that matter most and keep a lighter pace in spillover areas. The model sets the reach. Vehicle assignment decides how well that reach turns into delivery.
Coverage on paper doesn't mean much if the right vehicles aren't online in the right places. Once the map is set, screen uptime and route fit determine whether the campaign shows up the way it's supposed to.
Start with high-density zones: the blocks closest to the venue entrance, the main hotel cluster, and the top transit drop-off points. Put your highest-uptime vehicles there first. Real-time device monitoring helps you confirm which screens are online and spot connectivity issues before they hurt delivery.
Route fit matters just as much as location. Use historical route data and real-time GPS tracking to find drivers who already move through your target corridor on a steady basis. Then move those vehicles to the top of the event assignment list.
Driver schedules matter too. Line up shifts with the full event window, including the post-event surge.
Once coverage is locked in, screen format shapes how people take in the message. After vehicles are assigned, line up each format with the right stage of the event.
Rooftop LED screens are made for outdoor use. They reach pedestrians and nearby drivers around the venue perimeter. With brightness above 5,000 nits, they stay readable in direct sunlight. But people usually only see them for a few seconds, so the message has to hit fast. That makes these screens a strong fit for arrival routes and busy areas near the venue.
In-cab tablets play a different role. Passengers often spend 10 to 30 minutes in the ride, which gives you more room for longer messaging and direct-response offers. Because these tablets are touch-enabled, they work well after the event too, when riders have a bit more time to interact.
In many cases, the best event flight uses both.
| Screen Type | Viewing Context | Dwell Time | Best Event Use |
|---|---|---|---|
| Rooftop LED | External - pedestrians and other drivers | Seconds per pass | Arrival routes, venue proximity, brand awareness |
| In-Cab Tablet | Internal - captive passengers | 10–30 minutes per ride | Rides to/from venue, post-event direct response |
| Mixed Deployment | Both external and internal | Combined | Awareness on arrival, engagement during the ride |
A mixed deployment covers the full event journey. Rooftop screens drive awareness during the arrival wave. Then in-cab tablets turn ride time into a chance for deeper engagement.
Format choice also shapes how fast a campaign can go live and how easily it can change.
Event campaigns often run in short flight windows, sometimes just a few hours. Programmatic workflows handle inventory selection, geo-eligibility rules, pacing, and creative delivery automatically. Use geo-time rules to trigger inventory, pacing, and creative by location and time. When a vehicle enters the activation zone during the event window, the right creative plays. When it leaves, delivery pauses.
Cloud platforms can sync content changes across the fleet within minutes, which helps when schedules move or sponsor details change. Enroute View Media brings together rooftop LED screens, in-cab touchscreen tablets, and a cloud-based ad and screen management platform with real-time analytics and programmatic integration.
Live dashboards let you track screen uptime, playback verification, and impression counts while the event is happening. That means you can move budget into the strongest zones during the event instead of waiting until it's over.
With zones and fleet coverage locked in, the next step is messaging.
Where the ad appears matters. But what it says at a given moment matters just as much. As crowds move through a city, their mindset changes fast. That means your creative should change too. Pre-event, arrival, and post-event each call for a different offer.
Pre-event is your awareness window. Taxis moving through airport corridors, hotel districts, and transit hubs should run countdown messages or early-bird merchandise offers. These are the places where out-of-town attendees first arrive, and they’re already thinking about the event.
During the arrival window, urgency takes over. Rooftop LEDs on routes leading straight to the venue tend to work best with short, direct cues - entry details or last-minute ticket prompts. Keep the copy tight. Say what matters, fast.
Post-event is one of the most overlooked phases. Once the venue starts to empty, departing riders become high-value inventory for restaurant, nightlife, hotel, or rideshare offers. In-cab tablets work especially well here because passengers usually have a little time and are often deciding what to do next.
Use location, time of day, and weather to rotate creative in real time.
Phase timing shapes the offer. Audience movement shapes the audience.
Not everyone near an event is there for the event. Commuters, tourists, local residents, and in-market shoppers can all pass through the same few blocks while thinking about totally different things. Treat them as separate groups.
Then line up each message with the people actually moving through those zones.
| Audience Segment | Movement Pattern | Recommended Message Timing |
|---|---|---|
| Event Attendees (Arriving) | Transit hubs → Hotels → Venue | Pre-event: Countdown/merch; Arrival: Entry info/urgency |
| Event Attendees (Departing) | Venue exits → Nightlife/Hotels | Post-event: Dining, nightlife, or hotel offers |
| Urban Commuters | Residential → Business districts | Peak hours: Traffic alerts, alternative routes, routine services |
| Tourists | Landmarks → Hotels → Nightlife | Midday/Evening: Local attractions, multilingual hospitality offers |
| Local Residents | Neighborhoods → Local retail | Pre-event: Countdown awareness; Evenings/Weekends: Local services, community alerts |
| In-Market Shoppers | Retail zones, malls, competitor proximity | Arrival/Live: Flash sales, geo-conquesting ads near competitors |
Match the message to intent, not just location.
After the event, review delivery, exposure, and response. Once the activation wraps, the same geo-time rules used to run the campaign become the proof layer for what ran, where it ran, and what it drove. For event-based taxi DOOH, the KPIs that matter most are playback verification, impression estimates, engagement rates, and brand lift.
Timestamped GPS logs are the backbone of proof-of-play. They show which vehicle ran which creative, where it appeared, and when it played. High-resolution GPS can achieve location precision of under 1 meter, and that level of accuracy matters when you need to confirm that a vehicle actually covered a stadium corridor during the arrival window.
In-cab rides can generate more than one counted impression per trip. Tablet interactions, QR scans, and site visits can help show whether passengers responded to the message. Use only anonymized, aggregated, consent-aware audience data.
That proof only holds up when advertisers and fleet owners split responsibilities cleanly. A strong campaign starts with clear ownership.
| Responsibility | Advertiser / Media Buyer | Fleet Owner / Operator |
|---|---|---|
| Inventory Access | Purchases ad slots via direct or programmatic channels | Provides vehicle fleet and screen availability |
| Content Scheduling | Uploads creatives and sets flight dates and geotargeting rules | Monitors remote sync and local regulation compliance |
| Route Compliance | Defines geofences and time-fencing rules for event zones | Manages driver shifts to maintain zone coverage |
| Uptime Monitoring | Reviews delivery dashboards and reporting | Runs real-time device monitoring, maintenance, and connectivity checks |
| Proof-of-Play | Analyzes timestamped logs and impression estimates | Generates GPS-stamped playback verification reports |
| Optimization | Adjusts creative sequencing or targeting mid-flight based on performance | Reallocates vehicles to high-demand zones as needed |
Clear ownership keeps delivery, reporting, and optimization on track.
The strongest event flights close the loop between targeting, delivery, and reporting. Event-based taxi DOOH works best when geo-time targeting, delivery, and reporting stay aligned. Platforms such as Enroute View Media bring scheduling, analytics, and programmatic delivery into one place.
The best 2026 campaigns will be the ones with tight alignment between targeting, fleet coverage, and reporting. Success comes from matching the event phase, fleet coverage, creative timing, and verified delivery - and treating each phase of the event as its own opportunity.
It depends on your reach goals and how dense the market is. There’s no set minimum that fits every campaign.
Enroute View Media can support networks as small as 5 to 10 vehicles for testing and local targeting around event zones.
For larger campaigns, the platform can scale to 150 or more screens. Geo-time logic can also direct existing fleet inventory toward high-traffic event corridors, which helps maximize impression delivery.
Taxi DOOH works best near events and places linked to heavy traffic and peak buyer activity, such as:
Campaigns tend to perform best when they line up with crowd movement and connect to specific routes and venues through geo-fencing and real-time scheduling.
Measure event taxi DOOH ROI by tying campaign cost to outcomes with GTWA delivery data and tracked performance.
Use DigiStreamView campaign stats to monitor ad plays by:
If the same rider sees the ad more than once during a trip, count each view as a separate impression.
Then check geo-time targeting accuracy with high-precision GPS geofences. From there, calculate impressions, exposed audience, and engagement, and compare revenue or lift against spend for each event period and location.
Need pricing details?
EnrouteViewMedia is a Canadian technology company based in Edmonton, Alberta, Canada. The company was founded by a group of media entrepreneurs and engineering executives. Our mission is developing leading-edge digital media display technologies for taxicab rooftops and taxicab interiors advertising market. Through our easy to use ad delivery and management system, we assist our clients in reaching their customers with targeted exposure. EnRouteViewMedia continuously strives to be the global leader in digital geo-time targeted advertising media systems for modern taxi fleets.