
Plan, design, and measure in-taxi display ads with clear targeting, privacy controls, accessibility, playback verification, and pilot KPIs.
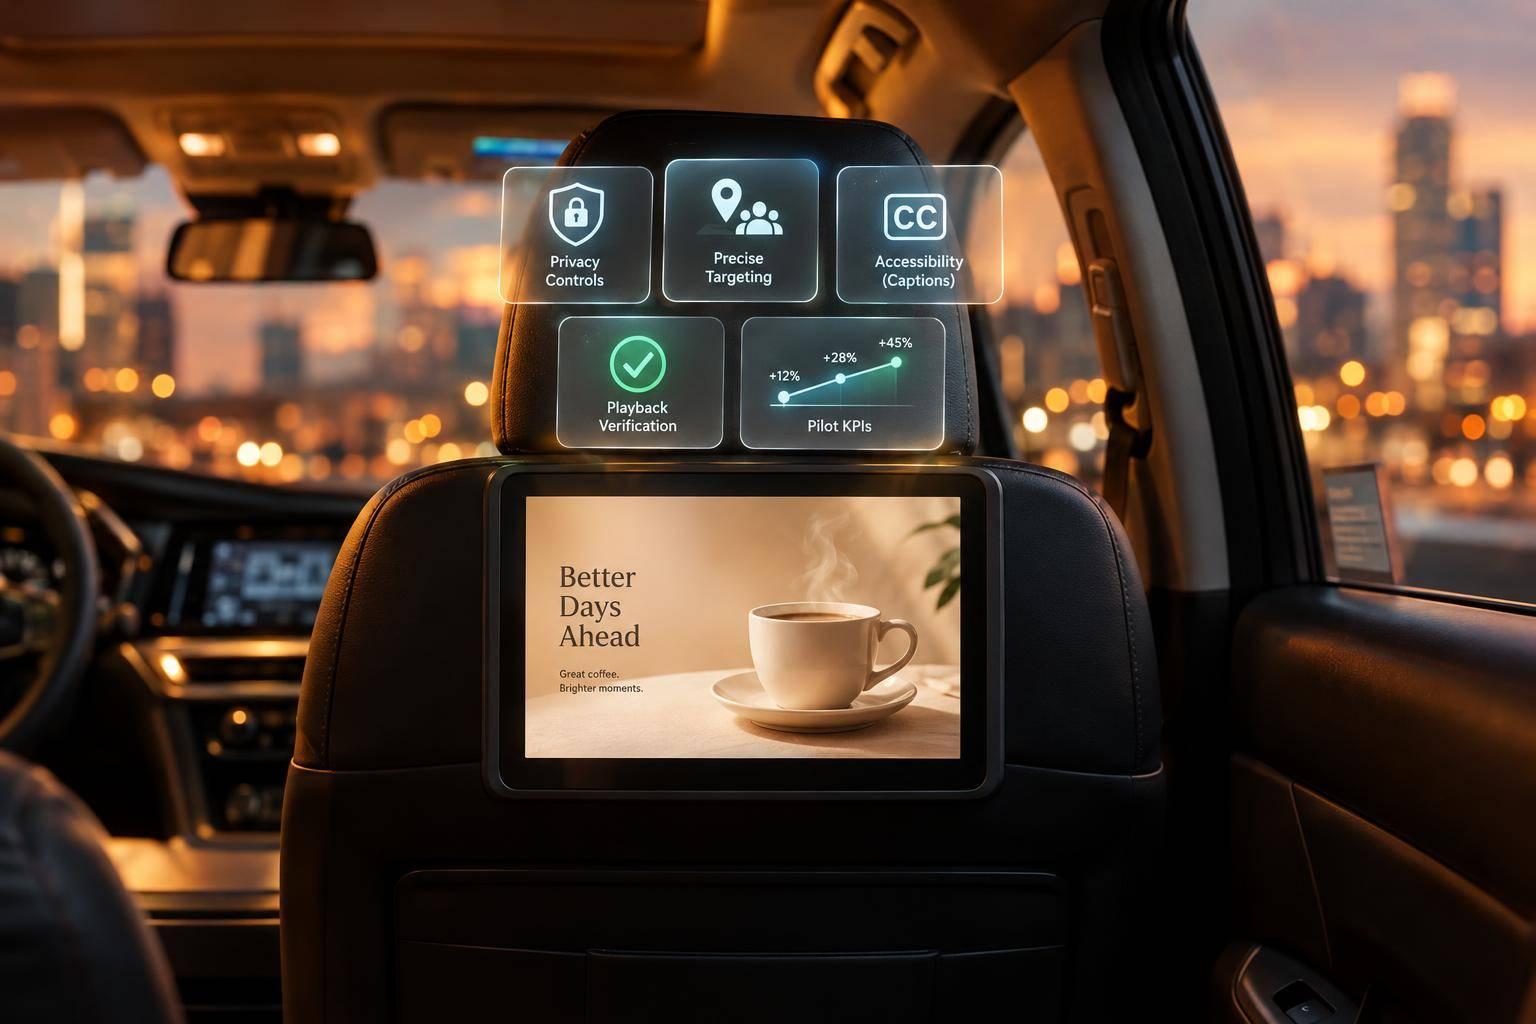
A played ad is not proof of attention - and a QR scan is not a sale. I recommend choosing one goal first: awareness, interaction, or an action on the passenger’s phone. Then keep touchscreen tasks to one to three steps and track delivery, engagement, and sales separately.
Here’s how I’d plan your campaign:
I’d review the pilot after two weeks, then scale only if it meets the targets set before launch. The test is whether passengers can act easily - and whether your records show what happened.

In-Taxi Display Engagement: From Planning to Results
Once viewing conditions are clear, define the trip context that will trigger each message.
Target the trip context - not a rider’s assumed identity or intent. Start with coarse, de-identified data, and block signal combinations that could re-identify a rider.
Check each signal’s source, availability, and permitted use. Get affirmative consent before collecting or using precise passenger or device location data. Confirm notice, retention, access, and deletion controls, and exclude sensitive-location targeting.
| Targeting signal | Practical use | Key limitations |
|---|---|---|
| City, ZIP code, or radius | Use city or ZIP targeting for broad market reach; use a radius for nearby-store offers | ZIP boundaries do not show intent; GPS drift can misclassify vehicles near radius edges |
| Polygon or geofence | Tailor messages to a named district, airport, campus, or event boundary | Boundaries may be inaccurate |
| Trip endpoints | Adjust ad content to departure or arrival context | Use only authorized origin/destination data; do not assume it exists |
| Route context | Match ad content to highway, downtown, airport, or corridor travel | Requires reliable location sampling; use coarse route categories |
| Day of week and time | Schedule weekday, weekend, morning, lunch, or evening messages | Timing does not prove intent or demographics |
| Ride duration | Choose short, medium, or long-form ads | Estimates can change; use coarse duration bands |
| Venue proximity | Deliver offers tied to nearby businesses | Proximity does not confirm visitation or purchase intent |
Hypothetical restaurant campaign: A restaurant could target vehicles within a 1.5-mile radius from 4:30 p.m. through 8:30 p.m. local time, Thursday through Sunday, with a dinner offer and QR code. If pickup or drop-off data is unavailable or unauthorized, do not infer it.
After setting audience rules, cap exposure and decide what plays when location data fails.
Set eligibility by geography, local time, campaign dates, and signal quality. If the system supports it, start with one exposure per ad loop and no more than three per trip. These are planning caps, not performance targets.
Play a brief introduction before the offer and call to action. Give eligible time-sensitive or contracted ads priority, followed by standard rotation and then house content. Document rotation weights and maximum loop share. Without a lawful persistent identifier, you cannot confirm repeat exposure across trips - a trip cap is not a passenger cap.
Stop location-specific delivery when coordinates become stale. Before launch, set a location accuracy threshold and a limit on how old location data can be. If either check fails, suppress nearby-store and arrival claims and switch to approved general ads.
During connectivity loss, play only cached assets that are still valid and do not need current location data. Record why the fallback was used, expire offers automatically, and provide an emergency stop.
Put the rules in writing before launch.
Approve a written specification that covers geography - a radius in miles, named area, or polygon - plus campaign dates, time zone, active days and dayparts, and daily and total budgets in U.S. dollars.
Include location accuracy and data-age thresholds, enforceable frequency and rotation limits, reporting aggregation thresholds, fallback assets, and an approval owner.
Use time-zone-aware rules so skipped or repeated DST hours do not cause gaps or overdelivery.
Choose one goal, one message, and one action. Show the brand and offer in the first frame. Every extra step can reduce engagement in a moving vehicle. Use plain U.S. English, large text, and a clear visual hierarchy. Put detailed terms on the mobile destination.
Keep tap paths to one to three steps, with visible Back, Home, and Exit controls. Separate passenger controls from driver controls, and never ask the driver to use the display. In-taxi screens need to work with short attention spans, motion, and quick actions.
| Format | Best-fit goal | Passenger action | Connectivity needs | Primary KPI | Delivery risks |
|---|---|---|---|---|---|
| Video | Awareness | Watch | Low when cached | Completed playbacks; brand lift | Playback alone does not prove attention; missing captions |
| Poll | Awareness or consideration | Tap an answer | Low with local storage; connection for reporting | Poll completions | Accidental taps; biased responses |
| Product browsing | Consideration | Tap categories or products | Moderate to high for current catalogs | Product-detail views | Slow loads; stale inventory |
| Coupon | Visitation or conversion | Save or redeem an offer | Connection for mobile page and validation | Redemptions | Expired offers; unclear terms |
| QR code | Off-screen action | Scan with a phone | Screen can stay cached; phone needs data. | Landing-page visits; downstream actions | Glare; small code; failed handoff |
| Map or store locator | Visitation | Select a location | Usually needs current location data | Locator opens; route starts | Inaccurate results; permission friction |
| Lead form | Data collection or conversion | Submit contact details | Connection for submission | Qualified leads | Typing friction; data exposure; consent errors |
For a hypothetical retailer, show a simple offer such as Scan for 20% off your next pickup order, link the QR code to a mobile coupon page, and let the passenger complete checkout on their phone. Avoid a lengthy onboard checkout that requires typing payment or address information on a shared vehicle screen. The campaign can measure first-frame exposure, QR scans, coupon saves, store-locator opens, and redemptions using a campaign token.
Use 4.5:1 contrast for normal text and 3:1 for large text. For vehicle use, treat 24 × 24 CSS pixels as the minimum - not the target. Make controls larger and well spaced, then test reach and tap accuracy on the installed screen.
Caption speech and meaningful non-speech audio, and make audio optional. Offer suitable language choices before longer interactions. The mobile page should be just as accessible, with readable text, labeled fields, keyboard and screen-reader support, and clear error messages.
A QR scan does not equal consent to tracking or marketing. Explain what data you collect, why you collect it, how long you keep it, who you share it with, and where passengers can read the privacy notice. Get separate permissions where required for marketing, device connections, camera access, and location access.
Prefer an anonymous coupon token over contact details, and move sensitive entry to the passenger’s phone. If you need an onboard form, mask sensitive fields. Clear entered values, session history, temporary tokens, and session storage after completion, exit, an ad change, or an inactivity timeout. Check that the browser’s Back button cannot reveal the previous passenger’s data.
Test on actual vehicle hardware from normal seated positions. Include daylight, nighttime, glare, motion, and weak connectivity. Check whether passengers understand the first frame, tap accurately, reach exit controls, read captions, switch languages, and scan QR codes with both iOS and Android phones.
Also test the mobile landing page, coupon delivery, submission errors, offline behavior, and session-data clearing. Approve the experience only when passengers can finish or exit promptly without providing unnecessary personal information - and no interaction draws the driver’s attention. Use the results to finalize the ad content before campaign delivery.
After the ad content passes hardware testing, move it into live playback and check that it runs on schedule. Use the CMS from Enroute View Media to upload approved content, schedule campaigns, and confirm playback on installed screens. Check device support for the approved content and review playback logs. Once playback is verified, apply the same rules to scheduling and inventory control.
Assign approved vehicles, routes, or geofences, then select screens, set playlist order, and define rotation rules. Specify fallback content for times when no eligible ad is available. Configure the platform to enforce approved campaign schedules, eligible-trip rules, and category restrictions. Document that direct-sold inventory takes priority over remnant or programmatic inventory.
Keep campaign setup, live monitoring, and delivery reconciliation separate using the controls below.
| Workflow | Operator task | Controls to verify | Records to retain |
|---|---|---|---|
| Campaign setup | Publish only approved versions to eligible screens. | Approval workflow, scheduling, playlists, category rules | Creative version, approval timestamp, targeting rules, screen assignments |
| Live delivery | Confirm completed playback and working touch actions. | Playback status, touch response, offline storage and synchronization | Screen ID, campaign ID, timestamp, completed duration, error codes |
| Device monitoring | Investigate offline screens, frozen players, and stale GPS data. | Online/offline status, screenshots, alerts, connectivity and GPS status | Last check-in, error codes, location timestamp, incident notes |
| Updates and access | Restrict publishing and track changes. | Role-based permissions, update history, multi-factor authentication where available | User changes, deployment timestamps, permission reviews |
| Reporting | Reconcile booked delivery with actual screen logs using proof-of-play. | Proof-of-play exports and agreed reporting fields | Playback logs, reporting period, retention deadline, delivery discrepancies |
Confirm the controls and reporting fields for each deployment. Set automatic retries for failed files, with approved fallback content if retries fail. Enforce expiration dates at the platform level, block unapproved versions, and pause location-specific ads when GPS data is stale. Agree on log retention in the insertion order or service agreement.
Before scaling the pilot, assign named owners for launch, monitoring, and incident response. Cover creative and legal approval, permissions, installation, device alerts, fallback ads, billing, and reporting.
Before launch, check installed fleet coverage, eligible inventory, secure mounting, power management, active connectivity, and local advertising rules. Run a small pilot through ignition cycles, geofence changes, scheduled updates, and connection loss. Then reconcile device logs with reports before expanding.
During the pilot, verify actual data usage, power draw, and licensing costs before scaling.
After launch, track what the system delivered, how passengers responded, and which business results followed.
Report results in three layers: delivery, engagement, and business outcomes. Delivery includes scheduled spots, completed plays, availability, and spend. Engagement includes touches, scans, sessions, and dwell time. Business outcomes include leads, visits, purchases, and revenue.
Keep platform-reported impressions separate from estimated audience exposure. Label audience figures as measured or modeled, and disclose data sources, coverage, exposure assumptions, and deduplication methods. Reach counts distinct people; frequency is their average number of exposures. If you can’t deduplicate people, report “estimated exposure opportunities,” not “unique viewers.”
| Goal | Primary KPIs | Supporting KPIs | Attribution method | Review cadence |
|---|---|---|---|---|
| Awareness | Estimated impressions, reach, frequency | Completed plays, availability, spend | Exposure modeling or market-level comparison; clearly label estimates | Weekly and post-campaign |
| Consideration | QR scans, landing-page sessions | Verified touches, dwell time | Tagged URLs, unique QR codes, campaign-specific landing pages | Daily monitoring; weekly review |
| Acquisition | Qualified leads, valid redemptions, purchases | Conversion rate, attributed revenue | Validated forms, promo codes, CRM and transaction records | Weekly and final report |
| Visitation | Incremental store visits | Visit rate, time-to-visit | Exposed-versus-control test or matched-market comparison | During and after campaign |
Define each metric before launch. Availability = available device time ÷ scheduled device time. Playback rate = completed plays ÷ scheduled plays. For touch and scan rates, state the denominator.
Count valid redemptions, validated leads, and confirmed transactions separately. Specify which sessions or audience qualify for conversion-rate calculations. Define spend as media-only or all-in, including production, technology, and measurement costs.
For touchscreens, separate screen dwell time from ad-level dwell time. State the data source, idle-time exclusions, and minimum session threshold.
Use campaign-specific landing pages, tagged URLs, and first-party conversion records. Scans count as engagement, not acquisition. Include attribution windows in every report: 24 hours may suit immediate offers, 7 days local visits, and 30 days considered purchases. Choose the window before reviewing results.
Compare exposed and unexposed groups where possible. Exposure-linked purchases show association. Incremental lift estimates additional outcomes above a sound control baseline. Existing purchase intent and other media can affect both.
Reconcile campaign reports with analytics and CRM records. Include independent audience verification when available, and report aggregated results by campaign, market, time period, and vehicle group.
Restrict data access and retention. De-identified movement data is still sensitive. Report both raw and valid events, and document duplicate filtering, bots, accidental taps, clock errors, and delayed records.
Cost per engagement = spend ÷ qualifying engagements.
Cost per lead = spend ÷ qualifying leads.
Test one variable at a time and agree on minimum sample sizes. Apply FTC privacy guidance and relevant state requirements, including notices and applicable opt-outs. MRC and OAAA guidance inform measurement; they do not certify results.
Review the launch pilot after two weeks and again at campaign completion, using predefined success criteria. Check for sufficient passenger exposure, relevant targeting, simple voluntary interactions, reliable playback, and transparent measurement.
Before scaling, approve the campaign goal, ads, privacy controls, delivery records, cost thresholds, and reporting owner. Scale only when the pilot meets the predefined exposure, interaction, and outcome targets.
Start small in one metropolitan area to fine-tune your audience segments and test performance before setting a fixed budget. Programmatic digital out-of-home advertising lets you adjust your spending, with cost per thousand impressions (CPM) typically ranging from $2.00 to $15.00, depending on screen type and location.
Use geo-time targeting to show ads only in high-value zones or during peak engagement hours. This helps reduce wasted spend.
Use closed-loop attribution to connect ad delivery data with point-of-sale systems or app analytics. This links ad exposure to business results.
For physical locations, use geofencing to compare visitation rates in areas with active ads against those without them. For digital actions, track QR code scans, NFC taps, or in-screen purchases. Sales lift studies can also compare route density with transaction data from nearby stores.
If your pilot produces limited data, don’t wait until the two weeks are up to review results. Track engagement with live dashboard analytics and adjust the campaign while it’s still running.
Run A/B tests with different ad versions across similar route segments to see which ones connect with your audience. If certain time slots or geographic zones get more engagement, use your management platform to move budget toward those segments.
Need pricing details?
EnrouteViewMedia is a Canadian technology company based in Edmonton, Alberta, Canada. The company was founded by a group of media entrepreneurs and engineering executives. Our mission is developing leading-edge digital media display technologies for taxicab rooftops and taxicab interiors advertising market. Through our easy to use ad delivery and management system, we assist our clients in reaching their customers with targeted exposure. EnRouteViewMedia continuously strives to be the global leader in digital geo-time targeted advertising media systems for modern taxi fleets.