
Live GPS and proof-of-play analytics let advertisers spot delivery issues, tie impressions to place and hour, and fix taxi ad campaigns mid-flight.
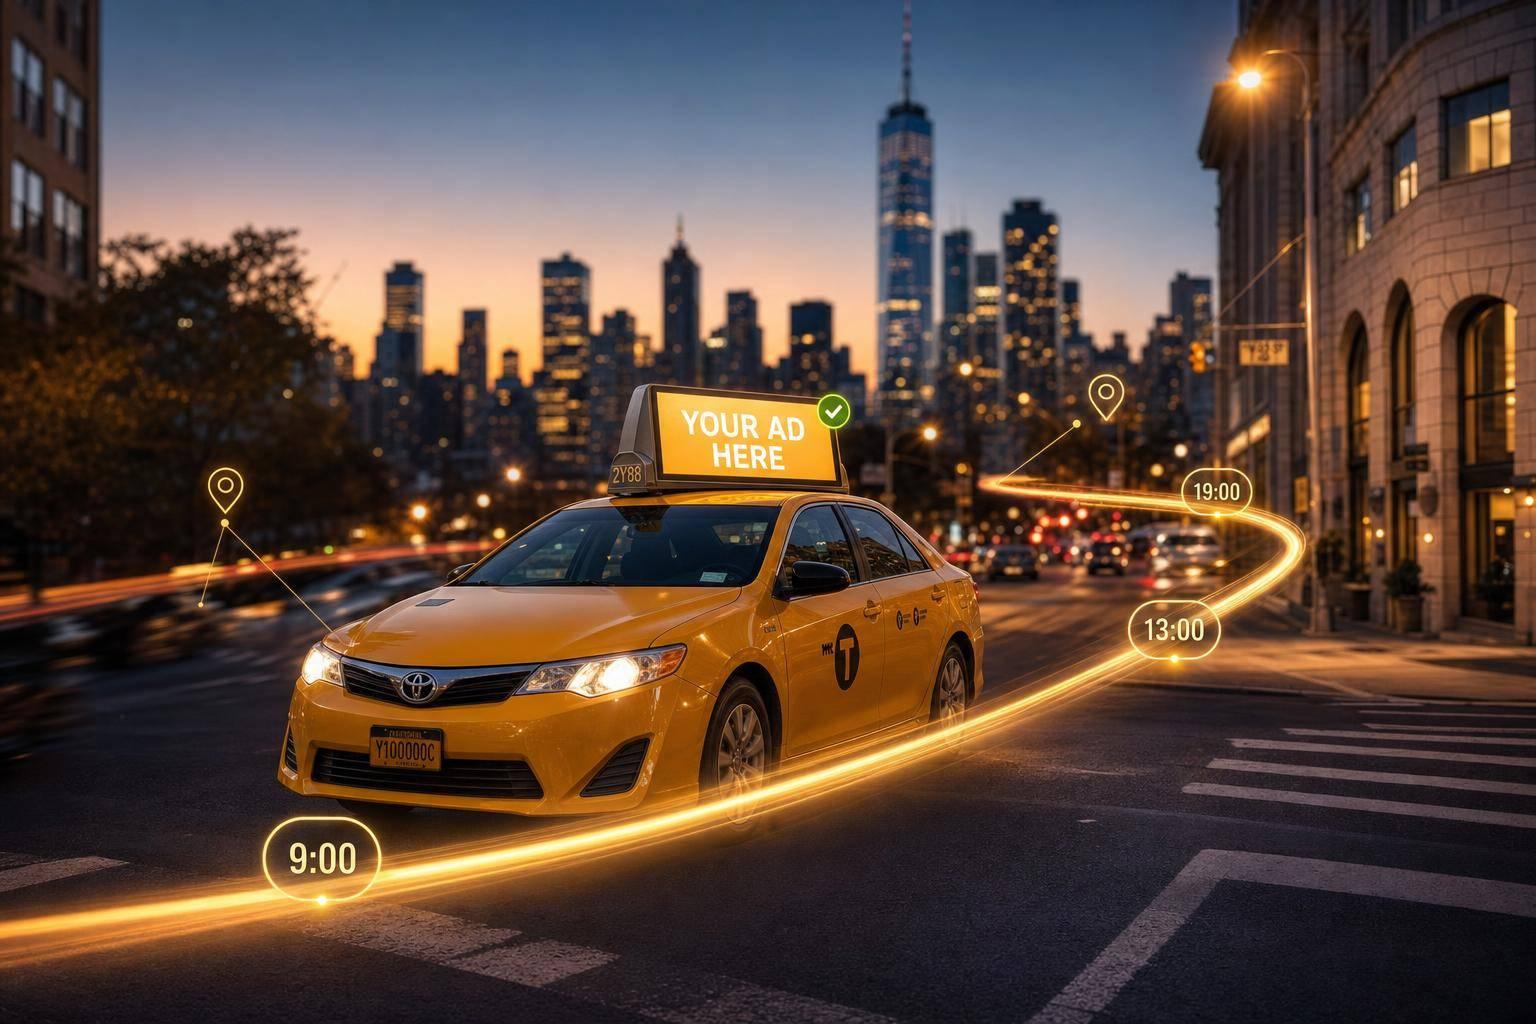
If I can’t see taxi ad delivery live, I can’t fix problems before budget is gone.
This article comes down to a simple point: live taxi ad reporting helps me check if ads ran, where they ran, when they ran, and whether screens stayed on during the campaign. It also shows how I can use GPS logs, proof-of-play records, route maps, and time-based reporting to spot weak delivery early instead of waiting for an end-of-campaign recap.
Here’s the short version:
One stat stands out: in 2025, a New York City taxi fleet used live GPS and playback reporting to shift ad timing into peak traffic periods and saw a 30% increase in audience engagement.
At its core, this article explains how I can turn raw taxi ad data into simple campaign decisions: keep, shift, pause, or fix.
Real-time analytics for taxi ads track a tight group of metrics. Put them together, and you get a clear picture of whether the campaign actually ran as planned.
These five core delivery metrics sit at the center of taxi ad measurement.
| Metric | Simple Meaning | How It's Measured | How Advertisers Use It |
|---|---|---|---|
| Impressions | Total number of times an ad was displayed | Playback logs; multiple views per ride count as separate impressions | To measure total exposure volume across the fleet |
| Reach | Estimated number of unique people exposed | Camera estimates or mobile-location data | To understand total unique audience size |
| Frequency | Average repeat exposure within a route or time window | Tracking repeat exposure within specific geofences or routes | To manage message retention and avoid ad fatigue |
| Dwell Time | How long the ad remains visible | Ad play duration (e.g., 10–20 seconds) and passenger presence detection | To gauge whether the creative had enough time to register |
| Route Coverage | Where ad delivery occurs | Real-time GPS tracking and corridor-level reporting | To verify ads are reaching target neighborhoods or zones |
On their own, these numbers tell you what happened. When you tie them to location and time, they start to say where and when it happened too.
Past the five core metrics, three verification points help advertisers check delivery: proof-of-play, route coverage, and screen uptime.
Proof-of-play shows that the ad ran at the right time and in the right place. Each log entry records the exact timestamp, the GPS coordinates at the moment of broadcast, and the play duration. That record helps with billing and audit checks.
Route coverage then shows where delivery took place in the field, using GPS breadcrumb trails matched to city zones and corridors. Screen uptime tracks whether each device stayed online or went offline during the campaign window. Taken together, these three data streams give advertisers a solid way to verify delivery: uptime shows the screen was online, route data shows the vehicle was inside the target geofence, and proof-of-play shows the creative rendered during that same window.
Delivery data gets much more useful when you break it down by time and place. A campaign can look one way during the morning commute and very different at midday or in the evening. If you don't segment by daypart, those swings are easy to miss.
In the U.S., advertisers often review taxi ad delivery by daypart and day of week to spot commuter hours, business district traffic, and nightlife peaks. Location-level reporting lets teams compare results across city zones like airports, business districts, and entertainment areas. From there, they can shift fleet coverage or ad scheduling toward the zones producing the strongest results.
"Real-time GPS tracking lets companies watch ads as they run and change them fast. This makes sure ads show up in the right places for the right people." - Verytek
Platforms like Enroute View Media support geo-time targeting, which pairs a location with a time window. That means advertisers can trigger ads only when a vehicle enters a defined zone during a high-value slot - for example, a lunch promotion that turns on when a taxi enters a business district at 12:00 PM. That time-and-place view sets up geo-time tracking, matching each play to a route and a time slot.
Geo-time tracking turns playback logs into proof of delivery tied to place and time. It does this by linking two live data streams during a taxi shift: GPS location pings and ad-play logs. When those two streams line up, the platform records each impression’s location, time, and duration. GPS logs can place a vehicle within 1 meter of the target zone, which helps confirm that delivery happened in the planned zone and during the planned time window.
Each impression is matched to a GPS point and timestamp. That creates a synced record tied to one exact place and one exact moment in the campaign.
Raw coordinates aren’t very useful on their own. So platforms turn them into heatmaps and corridor-level reports. These are the visual layer of geo-time tracking, showing where ads were active and how coverage was spread across an area.
Teams use these views to check coverage in key zones and corridors. It also makes it easy to see where a fleet is clustered and where coverage starts to thin out. Enroute View Media supports geofencing, so when a taxi enters a defined exposure zone, the platform triggers the relevant creative. Once that movement is mapped, teams can look at time-slot reporting to see when delivery was strongest.
Location data tells only part of the story. Hour-by-hour and shift-level data show when impressions were most likely to reach people. A taxi moving through a business district at 7:00 AM reaches a very different crowd than one driving through that same area at 10:00 PM.
Time-slot reporting breaks delivery down by hour, driver shift, or a custom campaign window. That level of detail helps teams line up delivery with demand peaks like lunch traffic, nightlife, and airport arrivals.
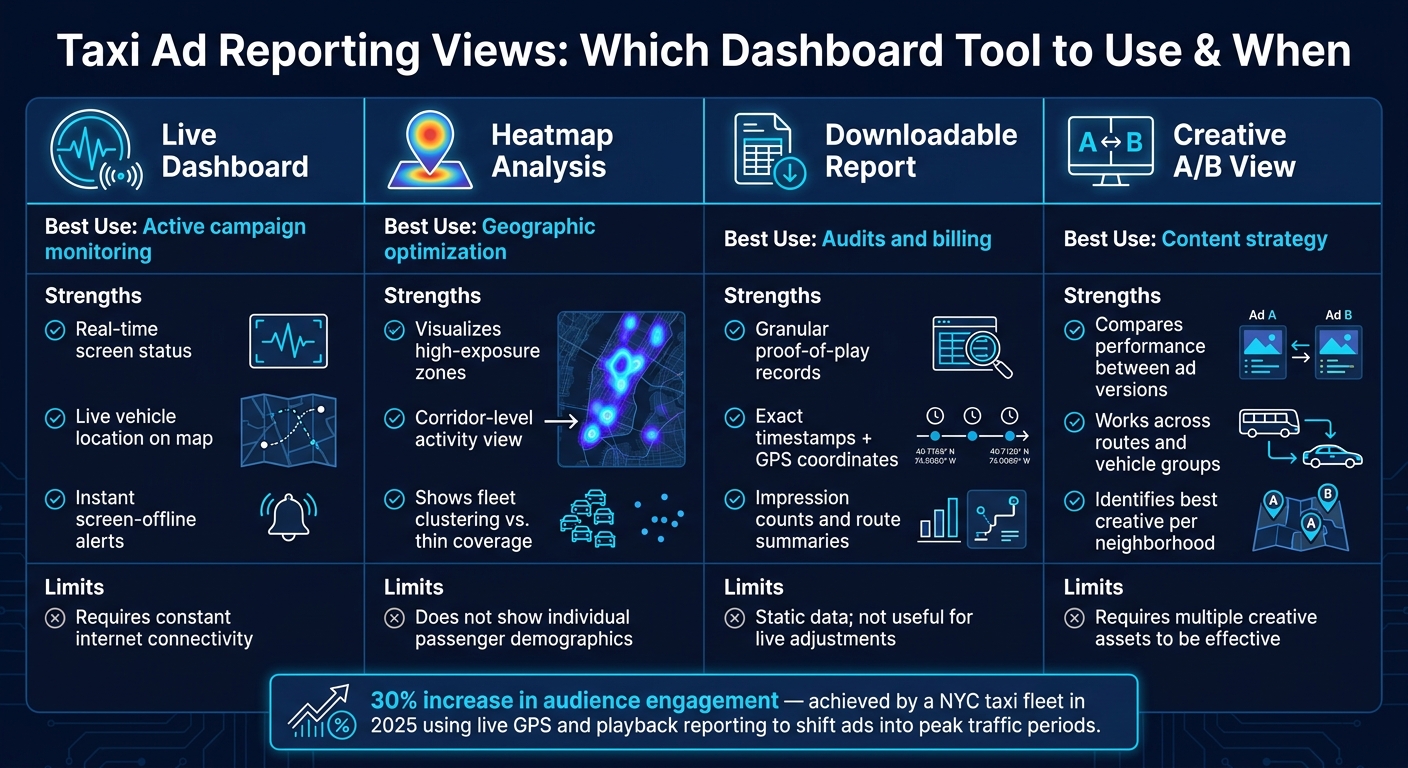
Taxi Ad Reporting Views: Which Dashboard Tool to Use & When
Once route and time data are synced, the dashboard turns those signals into live operational views.
The dashboard turns geo-time data into an operational view. At a glance, teams can see which screens are online, what creative is playing, and which vehicles are active on the map. If a screen goes offline, the platform flags it right away. It also shows live route status and zone-level delivery in the same view. That makes it easier to compare performance across creatives, routes, and vehicle groups without jumping between tools.
Enroute View Media's cloud-based platform brings these live views together, pairing real-time analytics with GPS tracking and geo-time targeted advertising in one interface.
The dashboard also shows which creative, route, and vehicle group performs best. Marketers can run A/B tests across different ad versions and compare results across creative, route, and vehicle-group combinations to see which setups work best in different neighborhoods.
The table below sums up the main reporting views and when each one makes the most sense:
| Reporting View | Best Use | Strengths | Limits |
|---|---|---|---|
| Live Dashboard | Active campaign monitoring | Real-time status, live screenshots, and vehicle uptime alerts | Requires constant internet connectivity for live updates |
| Heatmap Analysis | Geographic optimization | Visualizes high-exposure zones and corridor-level activity | Does not show individual passenger demographics |
| Downloadable Report | Audits and billing | Provides granular proof-of-play, timestamps, and GPS coordinates | Static data; not useful for immediate live adjustments |
| Creative A/B View | Content strategy | Compares performance between different ad versions | Requires multiple creative assets to be effective |
After the live campaign, the same dashboard becomes the reporting source for audits and billing. When a campaign ends or a client asks for documentation, the dashboard exports reports for billing, recaps, and audits. These reports pull together proof-of-play records with exact timestamps, GPS-linked locations, ad duration, impression counts, route summaries, time-slot breakdowns, and fleet uptime data. That gives teams a clear record for billing and review.
Once the dashboard is live, the job shifts. Now you're sorting real signal from plain noise.
A strong day on one route isn't enough to change strategy. Short-term spikes can happen for all kinds of reasons, so don't react too fast. Look for repeat patterns across multiple days or weeks before you change budget or swap out creative.
If one corridor keeps outperforming during the same time window, that's worth acting on. That's a pattern. A one-day spike isn't.
It also helps to compare like-for-like time windows before making changes. In plain terms, don't compare a random Tuesday lunch rush to a Friday evening push and treat them as the same thing. That kind of read only works when the data underneath is clean and consistent.
Taxi ad analytics are only as good as the hardware and data feed behind them. High-quality GPS systems can achieve location precision of less than 1 meter from the intended target.
For reporting to hold up, you need a few basics in place:
If one part of that chain slips, the numbers can look stronger or weaker than they should.
Focus on the patterns that repeat across routes, time windows, and vehicles. That's where real-time taxi ad data starts to become actionable.
Enroute View Media uses a high-resolution, 41-satellite channel GPS system to deliver location tracking accuracy of less than 1 meter from the intended target.
That level of precision supports exact geofencing and time-fenced advertising. It also gives you playback verification with timestamps and GPS-verified locations for each ad display, all available through a secure, real-time portal.
Enroute View Media gives you playback verification reports for every ad play, including timestamps, GPS-based location data, ad duration, and impression counts.
You can also monitor campaigns in real time through a secure white-label portal. Inside the portal, you can:
That means you’re not left guessing whether your campaign is running as planned. You can log in, check the data, and see what’s happening on the road as it happens.
Use real-time monitoring tools to tweak ad content, playlists, or triggers the moment performance data points to a change.
Look at reports with GPS locations, timestamps, and impressions to find the areas and time slots that perform best. Then adjust your geo-targeting to match. You can also track device health in real time, which helps keep campaigns live across your fleet.
Need pricing details?
EnrouteViewMedia is a Canadian technology company based in Edmonton, Alberta, Canada. The company was founded by a group of media entrepreneurs and engineering executives. Our mission is developing leading-edge digital media display technologies for taxicab rooftops and taxicab interiors advertising market. Through our easy to use ad delivery and management system, we assist our clients in reaching their customers with targeted exposure. EnRouteViewMedia continuously strives to be the global leader in digital geo-time targeted advertising media systems for modern taxi fleets.