
Model taxi DOOH payback: upfront costs, monthly SaaS/data/maintenance, fill rates, and cash-flow to estimate break-even.

If I’m a taxi fleet owner, the answer is simple: DOOH pays back only when monthly net revenue covers both setup costs and the monthly cost stack. In most U.S. markets, that means I need to watch hardware cost, fill rate, SaaS fees, data, maintenance, downtime, and payment delays - not just gross ad sales.
Here’s the short version:
The core formula is still easy:
Payback (months) = Total installed cost per vehicle ÷ Monthly net ad revenue per vehicle
Before I move ahead, I’d run three cases:
And I’d stress-test each one against:
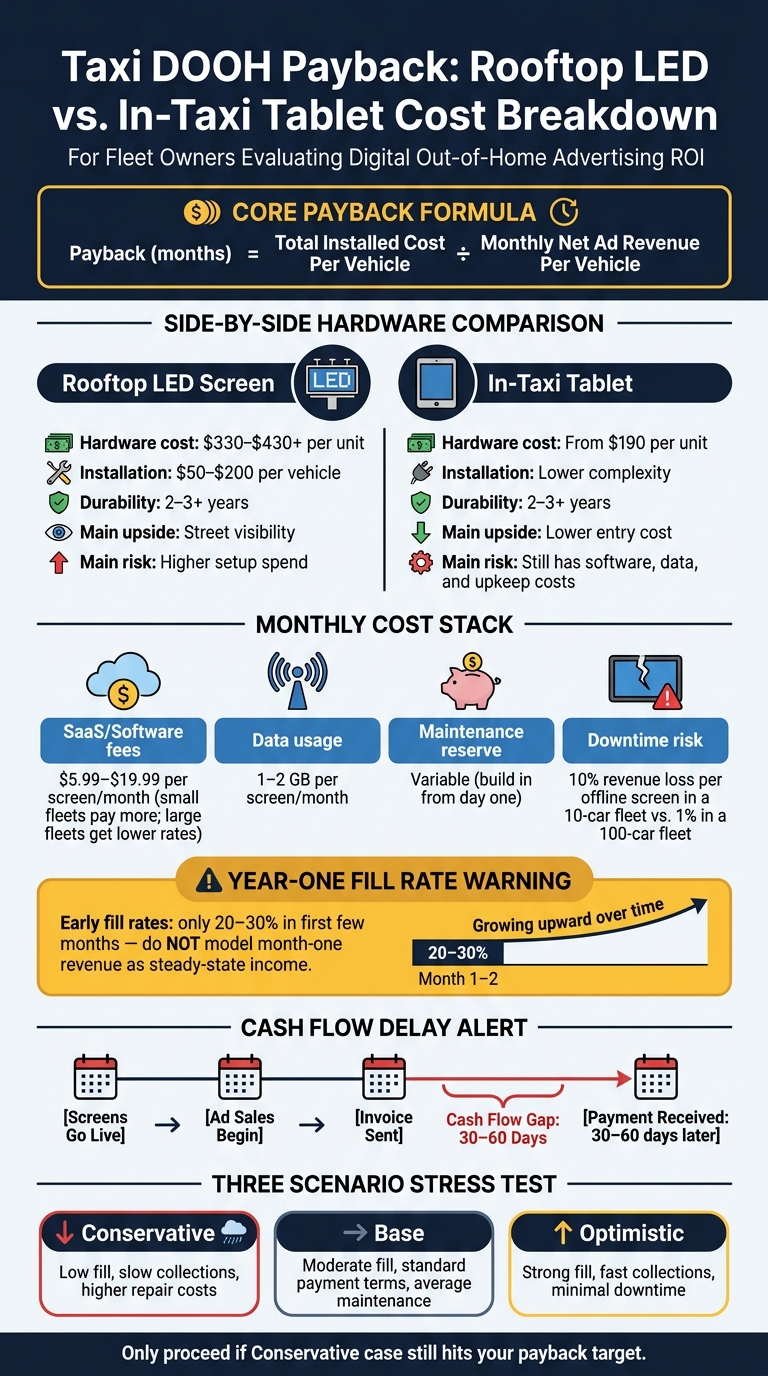
Taxi DOOH Payback: Rooftop LED vs. In-Taxi Tablet Cost Breakdown
| Screen type | Upfront cost | Main upside | Main risk |
|---|---|---|---|
| Rooftop LED | $330–$430+ hardware + $50–$200 install | Street visibility | Higher setup spend |
| In-taxi tablet | From $190 | Lower entry cost | Still has software, data, and upkeep costs |
So if I want a clean read on payback, I’d ignore top-line sales and focus on net cash per vehicle, month by month. That’s the only way to tell whether break-even happens in a few months - or drags out much longer.
Payback mostly comes down to three things: the type of screen, how much ad inventory you sell, and how much demand exists in your market. The goal is simple: estimate how many months of screen income it takes to earn back the install cost.
Rooftop LED hardware usually costs about $330 to $430+ per unit, plus about $50 to $200 per vehicle for professional hardwired installation. In-vehicle tablets come in lower, starting at about $190 per unit. That lower entry cost helps the math, but it doesn't erase monthly SaaS fees, data charges, or maintenance.
"Fill rates ramp up over time and depend on your market, programmatic demand, and sales efforts. In worst-case scenarios for new networks, early months may see low fill rates (e.g., 20–30%)." - Enroute View Media
That matters a lot in the first few months. A new network shouldn't treat month-one revenue like steady-state revenue. Early fill is often light, so it's smarter to assume only partial break-even at the start.
A simple per-vehicle model makes this easier to judge.
Use this formula: Upfront investment ÷ monthly net revenue.
The model depends on three inputs:
For small operators, monthly software pricing often lands around $14.99 to $19.99 per screen per month. Larger fleets may get pricing as low as $5.99 per screen. That gap can shift payback more than people expect.
Once you plug in those numbers, the next issue isn't just speed. It's how steady that payback stays from month to month.
Fleet size shapes both risk and revenue stability. If one screen goes offline for a week, that's about 10% of revenue in a 10-vehicle fleet but only about 1% in a 100-vehicle fleet. Same problem, very different hit.
Scale also helps with ad sales. Bigger networks tend to look better to programmatic buyers and larger advertisers, since those buyers often want a minimum impression count before they commit. Smaller fleets may need to lean more on local direct sales at first. Larger fleets can often support both direct deals and programmatic demand with less strain.
Of course, scale comes with a price tag. More vehicles mean more upfront spend and tighter operating discipline. Industrial-grade hardware usually lasts 2 to 3+ years when it's mounted well and protected from vibration, so repair and replacement costs should sit right alongside your payback estimate.
Once revenue timing is mapped out, contract terms and maintenance costs start to decide whether that payback estimate holds up.
Once screens are live, the main holdup usually isn't deployment. It's sales and collections.
Revenue tends to start slow, then build as more inventory gets sold. The biggest cash-flow gap is the stretch between launch and collection. After your screens go live, you still have to move through sales, invoicing, and payment collection. Direct deals often pay 30 to 60 days after invoice, which means a deal closed in week one may not hit your account until week six or eight.
Content can go live within minutes; billing is the delay.
Programmatic demand can help fill early inventory while direct sales are still ramping.
Your revenue model has a direct effect on cash flow. And the mix you choose can change how soon you hit payback.
Here's the simple trade-off:
Use the mix that gets you to positive monthly cash flow fastest.
Once revenue timing is clear, the next step is setting a sane year-one fill assumption.
Don't build your model around full occupancy in year one. A more cautious starting point is 20–30% fill in the first few months. Start there before you assume growth.
That kind of fill rate can still work. If monthly revenue covers your operating costs, you're in the game. And if uptime is strong and your routes include airport and downtown routes, even lower fill can still bring in solid monthly revenue. Your model should cover monthly operating costs like SaaS fees, data, and maintenance reserves.
Once you model payback, the contract shows how much of that money you actually keep.
A few lines in the agreement can change the math fast. Focus on three terms: fee structure, exit rights, and pricing control.
The first thing to check is revenue share vs. flat SaaS fee. Some deals take a share of ad revenue. Others charge a flat monthly fee per device and let you keep 100% of ad revenue. The flat-fee setup usually makes costs easier to track and gives you a cleaner path to payback.
Then look hard at cancellation and refund language. This is where owners often get hit with surprise costs. Check if fees are non-refundable and whether the provider can suspend access for non-payment or breach.
You also need to pin down who sets CPM. If the provider controls CPM, that puts a ceiling on what you can earn.
Ownership terms decide who takes the upfront hit and who pays when something goes wrong.
In a provider-owned setup, the provider keeps title to the hardware, but the fleet still carries insurance and transit risk until delivery.
Here’s the side-by-side view of the two models:
| Factor | Provider-Owned | Fleet-Owned |
|---|---|---|
| Capital exposure | Low - no large upfront buy | High - full hardware cost upfront |
| Insurance risk | Fleet owner insures from delivery | Fleet owner insures as asset owner |
| Maintenance responsibility | Warranty covers defects; fleet handles shipping for claims | Fully on the fleet owner |
If a fleet wants to avoid a big upfront spend, provider-owned hardware can be easier to get on the road. But there’s a catch: insurance needs to be active from day one.
After ownership, the next issue is uptime. And uptime is where repair budgets help protect cash flow.
Downtime is a straight revenue leak. If a screen is offline, you can’t sell that ad space.
Your main yearly cost buckets, per vehicle, include screen servicing, replacement parts, and connectivity. Devices usually use 1–2 GB of data per month, so data overages can add to your costs if no one is watching usage. Warranty claims can also mean prepaid, insured shipping back to the provider.
A simple rule of thumb:
Uptime monitoring helps limit lost revenue from offline screens. Enroute View Media's monitoring and analytics tools help you catch offline screens quickly, which matters because online time directly affects revenue.
Standard warranties also leave out a lot. They often exclude damage tied to accidents, misuse, unauthorized modifications, neglect, and transit. That means fleets should set aside extra money for repair surprises. A repair reserve should be part of monthly net revenue before you judge payback.
Payback comes down to a few hard numbers: installed cost, net revenue, fill-rate ramp, contract terms, and maintenance. Before you sign anything, run three cases with those inputs:
Use the cost ranges covered earlier for each case. The point isn't just to see the best-case outcome. It's to find out whether payback still holds up when fill is soft and costs come in higher than planned.
After the contract is signed, uptime and route quality do a lot of the heavy lifting. A screen that's offline earns nothing. And routes near airports and business districts can support stronger rates. Real-time monitoring helps you spot offline screens fast and cut downtime losses .
Ownership, warranty, and maintenance responsibility also shape how much of your modeled payback you actually keep. If those terms are fuzzy, your model can look fine on paper and still fall apart in practice. A clear warranty and a set maintenance budget help protect payback.
If the conservative case misses your target window, pause the launch or renegotiate the deal. Model the numbers first, then sign only if conservative payback still works after maintenance and downtime.
A realistic payback period comes down to three things: your market, your sales effort, and programmatic demand.
For new networks, fill rates usually start on the low side. In most cases, that means 20% to 30% at the beginning. As your inventory gets established and you add more programmatic partners, those rates tend to improve.
With Enroute View Media, your break-even point depends on whether ad revenue can cover the upfront hardware cost, which starts at $190.00 per unit, along with recurring monthly software subscription costs.
Reserve cash for three main buckets:
Focus on the terms that have the biggest effect on long-term cash flow and day-to-day operations:
Need pricing details?
EnrouteViewMedia is a Canadian technology company based in Edmonton, Alberta, Canada. The company was founded by a group of media entrepreneurs and engineering executives. Our mission is developing leading-edge digital media display technologies for taxicab rooftops and taxicab interiors advertising market. Through our easy to use ad delivery and management system, we assist our clients in reaching their customers with targeted exposure. EnRouteViewMedia continuously strives to be the global leader in digital geo-time targeted advertising media systems for modern taxi fleets.