
Track costs, set SMART goals, measure impressions, and use geofencing, QR codes, and real-time analytics to attribute conversions and calculate DOOH ROI.

Want to know how to measure the ROI of your Digital Out-of-Home (DOOH) campaigns? Here’s the short answer: track costs, set clear goals, measure impressions, and use tools like geofencing and QR codes to link ad exposure to real-world results.
DOOH advertising, especially vehicle-based solutions like taxi rooftop screens, is now highly measurable. Unlike traditional billboards, these campaigns allow you to track metrics like impressions, foot traffic, and even sales. Here’s how to do it:
For example, a $50,000 taxi ad campaign generating $150,000 in revenue delivers a 200% ROI. By analyzing performance with tools like Enroute View Media, you can adjust routes, times, or creative content to improve results in real time.
Want to dive deeper? Keep reading for a step-by-step guide to measuring DOOH campaign ROI effectively.
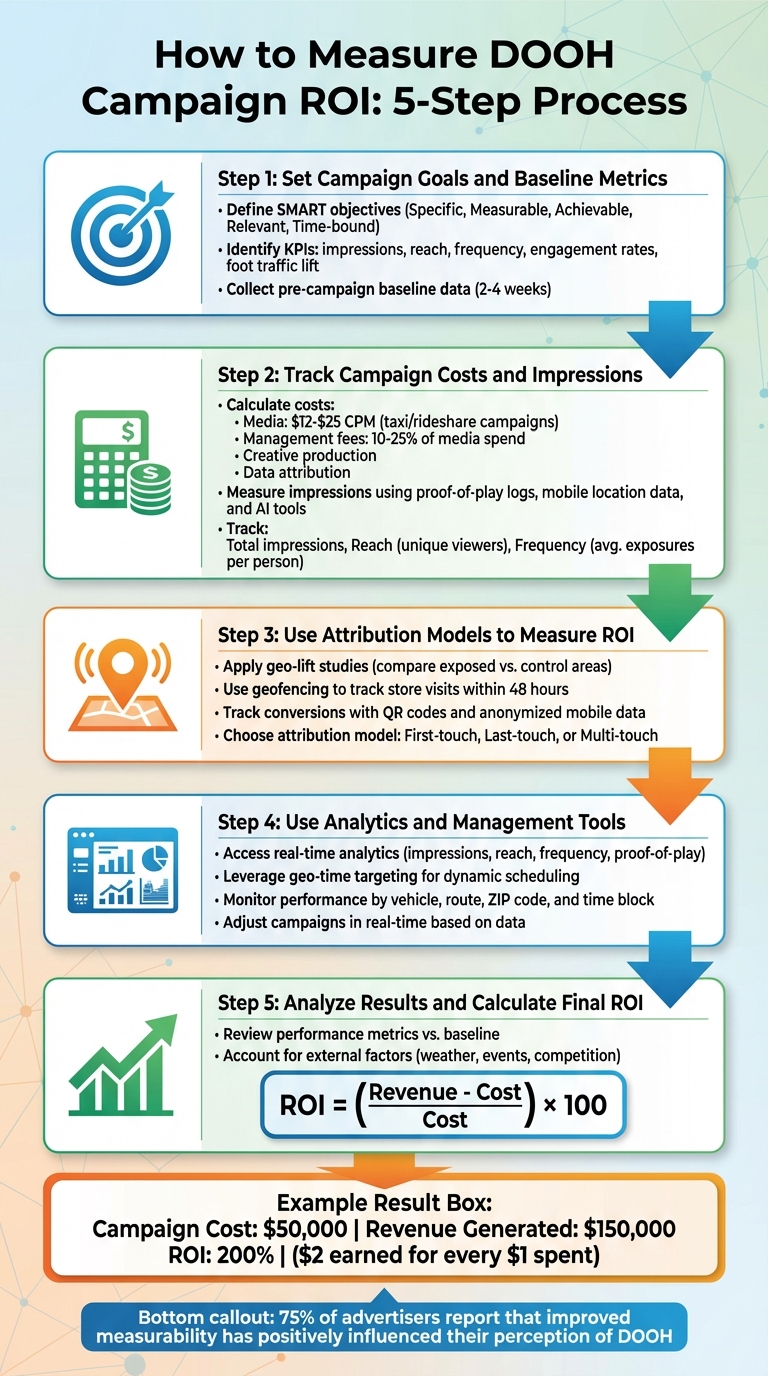
5-Step Process to Measure DOOH Campaign ROI
Before kicking off your campaign, it’s crucial to outline clear objectives. Start by focusing on specific business goals that align with what vehicle-based advertising excels at - reaching urban commuters during their daily routines. Your goals might include increasing brand awareness among downtown professionals, driving more foot traffic to nearby stores, or boosting online conversions through geo-targeted promotions.
Make sure your goals are SMART: Specific, Measurable, Achievable, Relevant, and Time-bound. For instance, instead of a vague goal like "increase brand awareness", aim for something concrete, such as "achieve a 20% increase in brand recall among Chicago commuters within two weeks." If your campaign uses taxi rooftop LEDs or in-taxi tablets, tailor your objectives to take advantage of geo-time targeting - like advertising breakfast specials during morning rush hours near coffee shops or promoting happy hour deals on evening routes through entertainment districts.
Once your objectives are set, choose the KPIs that will help you measure success. For awareness campaigns, focus on metrics like impressions (how often your ad is displayed), reach (unique viewers), and frequency (how many times each person sees your ad). For campaigns aimed at driving action, track engagement rates such as QR code scans from rooftop screens, touch interactions on in-taxi tablets, foot traffic lift to specific locations, and conversion rates linking ad exposure to purchases.
Vehicle-based DOOH campaigns make certain KPIs especially insightful. For example, location-based engagement can show how audiences interact with ads in specific areas - like scanning a QR code while stuck in traffic near your store. Similarly, foot traffic attribution uses anonymized mobile data to connect ad exposure (e.g., a passing taxi ad) to store visits within a certain timeframe.
To measure the impact of your campaign, you need a solid understanding of where things stand before you launch. Gather baseline data such as sales figures from your POS system, website traffic from tools like Google Analytics, foot traffic insights from mobile location data providers, and search volume for branded terms from search console tools. Collect this data over two to four weeks, broken down by specific locations and time periods relevant to your campaign.
For vehicle-based campaigns, make sure to track pre-campaign activity in the exact zones you plan to target. This baseline data will serve as your benchmark, helping you demonstrate the results of your DOOH investment. Setting clear objectives and collecting accurate baseline metrics are essential steps to calculate ROI and attribute success effectively.
Once your goals and baselines are established, the next step is to monitor your campaign's costs and impressions.
To get an accurate ROI for your campaign, you first need to track all associated costs. For vehicle-based DOOH (Digital Out-of-Home) campaigns, expenses typically fall into four categories: media, management fees, creative production, and data attribution.
Here’s an example to make it clearer: A three-week campaign in Chicago using 150 taxi screens had a total budget of $37,000 - broken down into $30,000 for media, $4,000 for creative production, and $3,000 for management fees. The campaign delivered 3.7 million impressions at a $10.00 CPM, reached 700,000 unique people, and achieved a $0.01 cost per impression and $246.67 cost per vehicle.
Once you’ve nailed down your costs, the next step is to measure impressions and reach to evaluate the campaign’s overall success.
Vehicle-based DOOH platforms make it possible to measure impressions and reach with impressive precision. They rely on tools like proof-of-play logs, mobile location data, and AI-driven audience modeling. Every ad play is logged with details like time, vehicle, and route. This data is then combined with anonymous mobile IDs and traffic patterns to estimate the number of unique exposures.
Geo-time targeting is a powerful way to maximize impressions by leveraging impression multipliers. These multipliers depend on traffic and mobility data. For instance, an ad displayed at 5 p.m. in Manhattan might generate 80–120 impressions, while the same ad at 2 a.m. in a quieter area might only yield 5–10 impressions. By scheduling ads to run in specific ZIP codes or near key venues during high-traffic hours, you can avoid wasting impressions during low-traffic times.
Platforms like Enroute View Media take this a step further with sensing technology that reports how many people actually see your ads - whether on rooftop LED screens or in-taxi tablets. Their cloud-based system provides real-time analytics, breaking down impressions, reach, and frequency by vehicle, route, ZIP code, and time block. This allows you to monitor metrics like impressions per dollar as the campaign runs. If certain segments underperform, you can pause them or reallocate budget to higher-performing routes without waiting for a post-campaign report.
Tracking these metrics helps you calculate three critical figures:
For example, a four-week campaign might deliver 4,000,000 impressions, reach 800,000 unique people, and achieve a frequency of 5. While higher frequency can improve brand recall, too much exposure may lead to diminishing returns. Understanding these numbers ensures you balance CPM with effective exposure.
Once you've tracked costs and impressions, the next step is refining your analysis with attribution models. One effective method is geo-lift studies, which help determine if your DOOH campaign is driving results. Here's how it works: you compare two similar areas - one exposed to your ads and one that isn't. For taxi-based campaigns, this could mean selecting neighborhoods or zones along your vehicle routes. In the exposed area, people see your rooftop LED screens or in-taxi tablets, while the control area remains ad-free. After the campaign ends, you analyze metrics like foot traffic, sales, or brand awareness in both zones. Partnering with mobile data providers can help track behaviors such as store visits following ad exposure.
Geofencing adds another layer by creating virtual boundaries around your taxi routes. When mobile devices enter these zones, you can track actions, such as store visits within 48 hours of seeing your ad. For example, one retail chain targeting commuters in five cities during the morning rush saw a 22% jump in in-store foot traffic and a 13% increase in mobile website visits within 48 hours, thanks to geofencing and real-time data syncing. Similarly, another retailer using geofencing in shopping areas achieved a 20% boost in foot traffic to targeted stores and a 15% rise in online sales from ad-specific ZIP codes over two weeks.
Enroute View Media takes this a step further with geo-time targeting. Their technology accurately tracks how many people were exposed to your ads - whether on rooftop screens or in-taxi tablets. Their real-time analytics allow you to define specific zones and measure performance based on route, ZIP code, and time block. This data forms the backbone of effective geo-lift and geofencing studies.
Next, let’s explore how direct conversion tracking can tie ad exposure to measurable outcomes.
QR codes are a simple yet effective way to track conversions. By displaying unique codes on taxi rooftop screens or in-taxi tablets, you can directly link scans to specific actions - like website visits, app downloads, or purchases. Adding UTM parameters to these QR codes ensures precise tracking of campaign performance.
Another powerful tool is anonymized mobile location data, which connects ad exposure to real-world actions while respecting privacy. For instance, when a mobile device passes near a taxi displaying your ad, data providers can track whether that device later visited your store, opened your app, or searched for your brand online. This method complies with privacy laws like CCPA by using aggregated, opt-in data without personal identifiers. Modern DOOH platforms utilize anonymous mobile IDs, GPS, and AI to deliver attribution accuracy comparable to digital campaigns. In fact, 75% of advertisers report that improved measurability has positively influenced their perception of DOOH.
Choosing the right attribution model is key to understanding how your campaign drives ROI. Each model assigns credit differently, and the choice depends on your campaign goals.
Here’s a quick comparison:
| Attribution Model | Pros | Cons | Best for Vehicle DOOH |
|---|---|---|---|
| First-Touch | Simple to implement; captures initial awareness from ad exposure | Ignores later influences like mobile searches | High-reach brand awareness campaigns |
| Last-Touch | Tracks the final action (e.g., QR scan or store visit); easy to measure sales | Overlooks the earlier role of DOOH ads | Direct-response campaigns using geofencing |
| Multi-Touch | Credits all touchpoints (ad → mobile → store); provides a full-funnel view | More complex; requires advanced data tools | Omnichannel campaigns tracking multi-step customer journeys |
For a comprehensive ROI analysis, consider combining models. Use first-touch attribution to measure awareness, last-touch for direct conversions, and multi-touch to understand the full impact of your taxi-based DOOH campaign across every stage of the customer journey.
Boosting your campaign's ROI means pairing detailed analytics with flexible management tools. By leveraging attribution models, you can fine-tune campaigns on the go. Enroute View Media’s platform provides live performance metrics, including real-time impressions, reach, frequency, play counts, and proof-of-play data. This lets you monitor how your taxi and rideshare campaigns perform across vehicles, routes, and time blocks. Want to dig deeper? You can break down data by ZIP code, time of day, and creative variations to quickly identify underperforming areas or time slots. This insight allows you to reallocate your budget to lower-cost, high-engagement segments in hours rather than weeks.
The platform also features geo-time targeting, enabling you to schedule ads dynamically based on GPS location and specific time windows. For instance, a restaurant chain in New York City could target weekday lunch hours (11:00 AM–2:00 PM) within a half-mile of Midtown offices, promoting lunch specials. Later in the day, ads could switch to happy-hour deals near entertainment hubs after 5:00 PM. Enroute's system syncs ad exposure logs with anonymized mobile location data, allowing you to track spikes in store visits, app downloads, or website traffic during specific geo-time slots. With this information, you can adjust bids, creative content, or route strategies daily, ensuring steady improvements in ROI.
Once your analytics are in place, simplify campaign management with centralized tools.
Enroute View Media’s cloud-based platform makes managing multiple vehicle screens a breeze. This centralized system handles creative uploads, scheduling, proof-of-play data, and reporting, giving you full control over rooftop LED screens and in-taxi tablets across your entire fleet - all from a single interface. For campaigns spanning multiple cities, you can upload creative content once and assign different schedules, routes, or time windows by city or vehicle type. Fleet owners and media buyers in the U.S. can monitor network health, track KPIs, and manage campaigns through one dashboard, making it easy to compare performance metrics - like Chicago rideshare screens versus Miami airport taxis - and reallocate budgets to areas with the lowest cost per conversion.
The platform also supports quick creative updates, which is perfect for time-sensitive campaigns like weekend sales, game-day promotions, or flash deals. This flexibility not only reduces operational costs but also allows you to react swiftly to real-time performance data.
As Sebastian, CTO of Aceme, shared: "enRoute partnership has helped us scale faster, more efficiently, and cost-effectively."
Enroute View Media offers three plan tiers tailored to different campaign sizes and analytics needs:
| Plan | Features | Best For |
|---|---|---|
| Basic | Dashboard access, campaign scheduling, proof-of-play logs, basic impression estimates, geo-time presets, PDF/CSV reports | Small fleets, local advertisers |
| Professional | All Basic features + custom geo-time rules, route-level insights, multi-vehicle support, programmatic integration | Growing businesses, multi-city campaigns |
| Enterprise | All Professional features + white-labeling, advanced analytics, API access, multi-user management | Large operations, agencies, national campaigns |
Choosing the right plan depends on factors like the size of your fleet, your need for API integration, and whether white-labeling is important for your operations. With the right tier, you can connect Enroute's exposure data to mobile location providers, web analytics, and QR code tracking, giving you a complete view of how your taxi-based DOOH campaigns drive conversions.
Once your campaign wraps up, it’s time to dive into the data and see how it performed. Start by comparing the metrics you established before launching the campaign with the results you’ve gathered. Look at key data points like impressions, reach, frequency, foot traffic increases, engagement rates (e.g., QR code scans or website visits), and conversion rates. Enroute View Media's dashboard can provide these insights. If you're using vehicle-based DOOH, focus on location-specific engagement - did those taxi rooftop screens bring more people to your stores in the targeted ZIP codes? Use anonymized mobile location data to track foot traffic within 48 hours of ad exposure.
Take it a step further by comparing results between targeted zones and control areas. Break down the data by route, time of day, and even creative variations to identify trends. For instance, did ads running during lunchtime near Midtown offices perform better than evening ads in entertainment districts? Use reporting tools or API integrations to cross-check this data with your CRM for a more complete picture.
Once you’ve reviewed the data, account for any external factors that might have influenced your results.
External influences like weather, traffic conditions, seasonal events, or competitor activity can skew your campaign’s outcomes. For example, a rainy week might reduce the visibility of rooftop LED ads, while a local festival could increase foot traffic that’s unrelated to your campaign. To factor in these variables, compare your campaign data against historical benchmarks, weather reports, and traffic data from APIs. Control group comparisons can also help isolate the impact of your DOOH campaign.
If anomalies occur - like a snowstorm during your campaign’s final days - adjust your analysis accordingly. Exclude those days from your calculations or use historical averages to make projections. This ensures your ROI reflects the true effectiveness of your ads, not external events.
Once you’ve adjusted your data, it’s time to calculate your ROI. Use this formula: ROI = ((Revenue - Cost) / Cost) × 100.
Here’s an example: Say you ran a two-week taxi rooftop LED campaign that cost $50,000 ($40,000 in media costs and $10,000 in production). If the campaign generated $120,000 in store sales (tracked via mobile data) and another $30,000 from QR code-driven conversions, your total revenue would be $150,000. Plugging these numbers into the formula gives you an ROI of 200%. In simpler terms, you earned $2 for every $1 spent.
When attributing revenue, be precise. Use Enroute View Media's geo-time targeting logs to link ad exposure directly to conversions. For instance, did sales noticeably increase in targeted ZIP codes during campaign hours? Cross-check this with your sales system or CRM for confirmation. One example: a local retail chain saw a 20% boost in foot traffic and a 15% rise in online sales from targeted ZIP codes after a two-week DOOH campaign in busy shopping areas. Always adjust for external factors before finalizing your ROI to ensure it accurately reflects your campaign’s performance.
Measuring the ROI of a DOOH campaign begins with setting clear and measurable goals. Whether it's boosting store visits by 10% in Q2, generating 2,000 qualified leads from specific New York City ZIP codes, or driving app downloads, having concrete objectives ensures your ad spend is tied to real business outcomes - not just vague awareness metrics. Start by collecting baseline data for sales, website traffic, or foot traffic to pinpoint the incremental impact of your campaign. This builds on the detailed planning steps discussed earlier.
Once your objectives and baseline data are in place, focus on tracking costs with precision. Record all campaign expenses - media, creative, data fees - in U.S. dollars for accurate analysis. Leverage analytics platforms that calculate key metrics such as cost per visit, cost per order, and revenue per impression. Interestingly, 75% of advertisers say better measurability has reshaped their perception of DOOH campaigns.
With cost data and objectives in hand, choose attribution methods that directly connect ad exposure to measurable outcomes. Tools like geo-lift studies, geofencing, and QR codes provide actionable insights. For instance, Enroute View Media offers streamlined analytics for taxi and rideshare campaigns, combining geo-time targeting with attribution models. These tools help you test creative variations, analyze routes, and adjust budgets to focus on the most effective combinations - all while keeping costs aligned with local market conditions.
To evaluate performance, calculate ROI using the formula: ((Revenue – Cost) / Cost) × 100. Real-time analytics make it easy to see how specific screens influence store visits, website traffic, or sales - sometimes within days of launch. Use these insights to refine your strategy for future campaigns.
Finally, post-campaign analysis is essential. Review the data to fine-tune targeting, experiment with ad formats, and optimize budget allocation. Every step - from setting baselines to leveraging real-time analytics - feeds into a comprehensive, data-driven approach that ensures every dollar spent is accounted for. As DOOH measurement tools and programmatic platforms advance, this level of accountability will only become more powerful.
To create effective SMART goals for your DOOH campaign, ensure they’re Specific, Measurable, Achievable, Relevant, and Time-bound. For instance, you could aim to boost impressions by 20% within the next month or increase engagement rates by a certain percentage within a defined period.
Use tools like real-time analytics to monitor key metrics such as impressions, engagement, and conversions. Regularly analyze this data to spot trends and fine-tune your strategy for better results. Solutions like those from Enroute View Media can simplify performance tracking and help align your campaign goals with measurable outcomes.
When it comes to measuring the success of DOOH campaigns, two attribution models stand out: multi-touch attribution and data-driven attribution.
Multi-touch attribution spreads credit across various interactions in the customer journey. This provides a more complete picture of how different touchpoints contribute to conversions, helping marketers see the bigger picture.
Data-driven attribution, on the other hand, relies on advanced algorithms to pinpoint which interactions have the strongest influence on campaign outcomes. It’s a more analytical approach, offering insights based on actual performance data.
Both models play a key role in evaluating campaign performance. They help marketers fine-tune their strategies and get the most out of their investment. For businesses using cutting-edge DOOH solutions, these tools are critical for understanding how audiences engage and achieving measurable results.
Real-time analytics offers a powerful way to monitor key performance indicators such as audience engagement, impression counts, and location-specific data. By diving into this data, you can make informed tweaks to your campaign - whether it’s sharpening ad targeting, adjusting the timing of your ads, or refreshing creative content to resonate more effectively with your audience.
Using tools like those from Enroute View Media, you can tap into geo-time targeting and instant insights to adjust your campaigns on the go. This flexibility helps you stay ahead in a constantly shifting advertising landscape, ensuring your efforts deliver maximum impact and a better return on investment.
Need pricing details?
EnrouteViewMedia is a Canadian technology company based in Edmonton, Alberta, Canada. The company was founded by a group of media entrepreneurs and engineering executives. Our mission is developing leading-edge digital media display technologies for taxicab rooftops and taxicab interiors advertising market. Through our easy to use ad delivery and management system, we assist our clients in reaching their customers with targeted exposure. EnRouteViewMedia continuously strives to be the global leader in digital geo-time targeted advertising media systems for modern taxi fleets.